ENOVATE LOGO 2022 1
data visualization services cover 1

Enovate LLC helps virtualize and analyze critical data to business users via intuitive visuals, enabling customers to spot trendstrack business goal achievementscompare the performance of various categories, products, brands, etc.

We provide data visualization advisory, implementation, and support services to help you transform large and complex datasets into appealing visuals to answer your specific business questions and make data-driven decisions promptly and efficiently.

Why Choose Enovate LLC

  • Data analytics and data management services since 2010
  • Data warehousing and BI expertise since 2011
  • Big data services since 2013.
  • Microsoft Power BI services since 2016.
  • Partnerships with Microsoft, Amazon, Oracle, and other tech leaders.
  • Expertise in 30+ industries, including manufacturing, retail and wholesale, professional services, healthcare, financial services, transportation and logistics, telecommunications, energy, and others.

Data Visualization Use Cases We Cover

Enovate’s team can help you turn data from diverse sources into immersive visuals, which enables monitoring goals and results, identifying opportunities, predicting demand, and more. 

These are some of the use cases we cover:

corporate performance

Corporate Performance

  • Benchmarking financial performance data for revenue optimization strategies.
  • Department and employee performance monitoring and analysis.
  • Customer and product analytics.
  • Procurement analytics, supplier screening and monitoring.
financial 2

Financials

  • Tracking a company’s revenue, expenses, and profitability to improve financial forecasting and budget planning.
  • Identifying and managing financial risks.
  • Financial data monitoring.
manufacturing 2

Manufacturing

  • Monitoring equipment performance to optimize overall equipment effectiveness and manufacturing process quality.

  • Uncovering defects in manufacturing processes to speed up product development and improve product quality

supply chain 2

Supply chain

  • Identifying demand drivers to improve demand planning accuracy and optimize order management.
  • Monitoring procurement data and conducting spend analysis to identify rationalization opportunities.
  • Spotting trends and patterns throughout the delivery process to identify and predict risks and optimize the logistics.

Marketing and sales

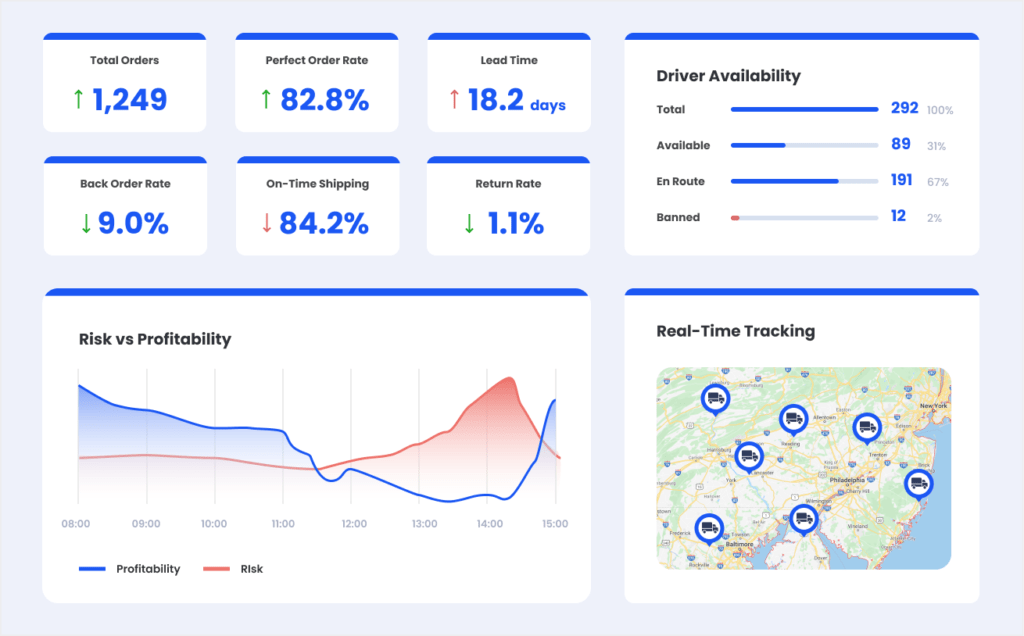
  • Predicting a prospect’s response to marketing activities for improved planning and optimized budgeting of marketing campaigns.
  • Customer segmentation to design personalized marketing campaigns, cross-selling and upselling strategies.
  • Customer sentiment analysis to increase product/service quality.
  • Customer profitability analysis to optimize the sales funnel.

HR data visualization

HR

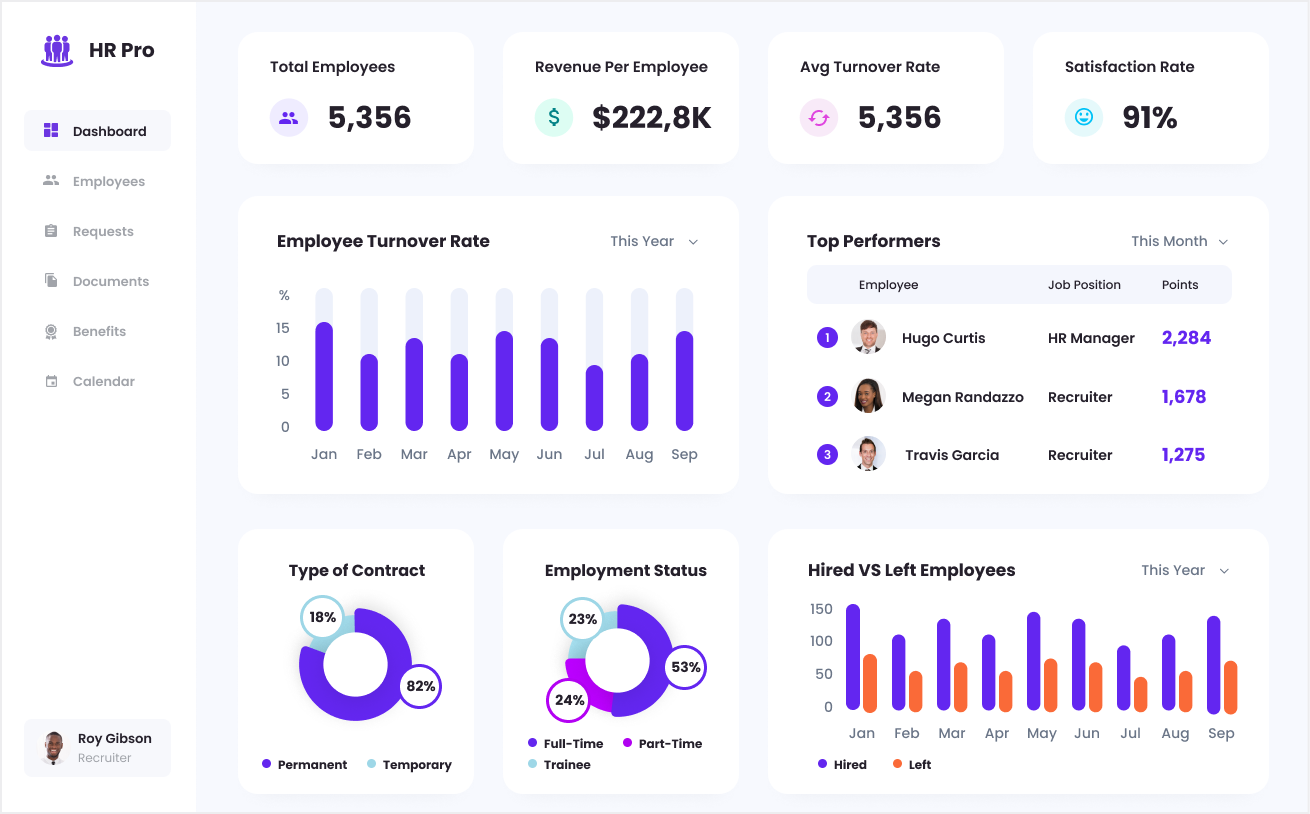
  • Keeping track of employees’ activities to determine the performance gaps and devise measures to enhance staff performance.
  • Visualizing data for talent management (applicant data, current recruitment needs, best performers, etc.) to make informed decisions within the recruitment process.
  • Analyzing retention activities on the employee productivity to identify the employee satisfaction drivers and reduce employee turnover.

Asset data visualization


Contact Us

We provide outside-the-box Solutions

ERP, CRM, ON-PREMISE SOFTWARE, VOIP, and more...

Please fill in your details and we will get back to you ASAP.